

Home › Knowledge Hub › Infection Surveillance › Using Surveillance Data for Continuous Quality Improvement in Aged Care IPC
Infection Surveillance
By Lyndon Forrest, Managing Director · Clinically reviewed by Bridgette Mackie & Dianne Newey, Clinical Directors · September 2026 · Updated November 2026 · 10 min read
Using Surveillance Data for Continuous Quality Improvement in Aged Care IPC
TL;DR —
Surveillance data in aged care IPC is only valuable when it drives continuous quality improvement (CQI). The Aged Care Infection Prevention and Control Guide (Chapter 9) says that monitoring infections will not change infection rates unless it is linked to prevention strategies or continuous quality improvement activity. The Plan-Do-Study-Act (PDSA) cycle is a widely used framework for translating surveillance findings into interventions, testing them and measuring their impact. Audit and feedback — systematically measuring practice, comparing against a standard, and feeding results back to staff — is an evidence-based CQI strategy. Surveillance findings must reach both clinical staff (to change practice) and governance committees (to allocate resources and monitor improvement). Sustained improvement requires embedding changes into systems, not relying on individual behaviour.
Why Must Surveillance Data Drive Quality Improvement — Not Just Reporting?
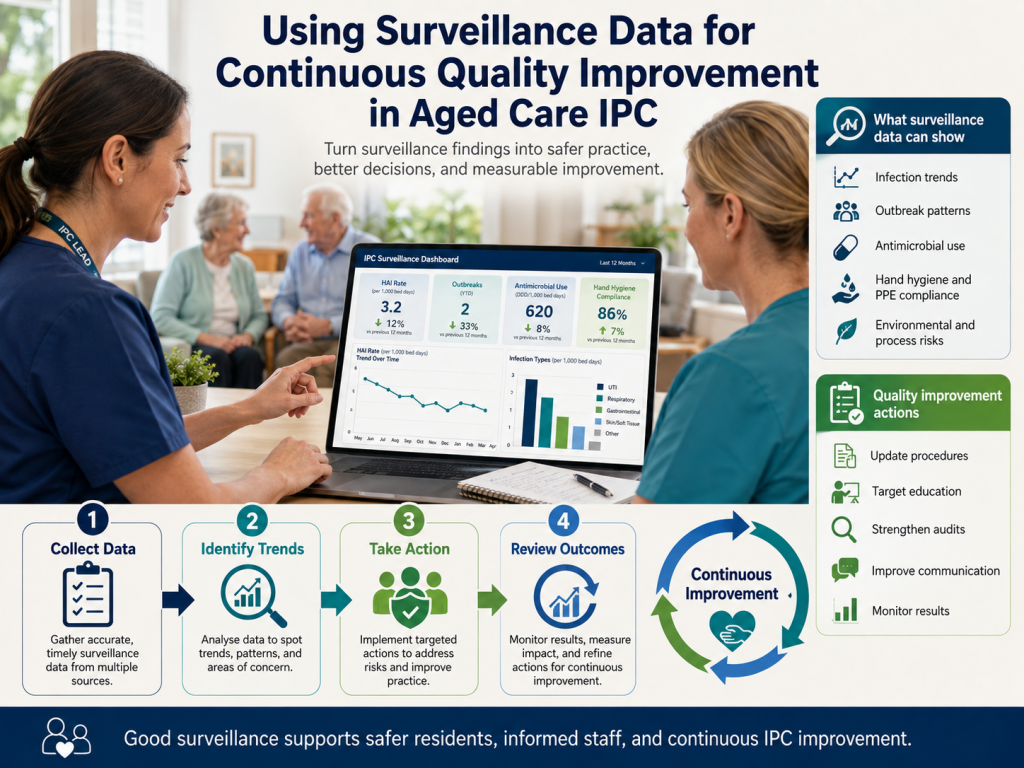
Surveillance quality improvement in aged care IPC requires a fundamental shift: from collecting data for compliance to collecting data for action. Many aged care facilities collect infection data, calculate rates, and produce reports — but never use that data to change practice. This represents a failure of the surveillance cycle
The Aged Care Infection Prevention and Control Guide treats monitoring as part of quality improvement: data feeds improvement activities, and those activities are evaluated through further monitoring, creating a continuous loop.
The Strengthened Aged Care Quality Standards (effective 1 November 2025) require an IPC system (Standard 4, Outcome 4.2, Action 4.2.1) and processes to minimise and manage infection that are informed by infection rates (Standard 5, Outcome 5.2, Action 5.2.2). To show these are working, providers need more than a record that infection data was collected: they need evidence that the data was analysed, reported to the governing body and used to improve care.
For the fundamentals of infection surveillance in aged care, see Infection Surveillance in Aged Care: A Complete Guide
How Does the PDSA Cycle Apply to IPC Surveillance?
The Plan-Do-Study-Act (PDSA) cycle is a widely used framework for turning surveillance findings into improvement. Other quality improvement methods also work. The Aged Care Infection Prevention and Control Guide describes monitoring as part of continuous quality improvement but does not require one method. Each PDSA cycle is a structured experiment that tests whether a specific intervention improves an outcome measured by surveillance data.
Plan
The Plan phase uses surveillance data to identify a problem and design an intervention. Surveillance analysis shows that the UTI rate has risen from the 12-month baseline of 1.5 to 2.5 per 1,000 resident-days over the past quarter. Further analysis of the urine tests and antibiotic courses for suspected UTI shows that 60% were ordered without documented urinary symptoms. (This is a clinical audit measure, separate from the surveillance rate, which counts only events that meet the McGeer definition.) The planned intervention: implement a clinical decision support checklist that prompts a clinical assessment and documentation of urinary symptoms before a urine specimen is sent. The checklist includes red flags (fever, rigors, new confusion with abnormal observations, low blood pressure, fast heart or breathing rate) that trigger immediate escalation to the registered nurse and medical practitioner, so the checklist never delays care for an unwell resident.
Need help implementing this in your facility? The IPS Hub gives your IPC Lead instant access to ready-made policies, procedures, and audit tools — updated monthly.
Do
The Do phase implements the intervention on a small scale. The clinical decision support checklist is trialled on one unit for 4 weeks. Staff are trained on the checklist. Data collection continues throughout the trial period
Study
The Study phase analyses the results. Surveillance data from the trial unit is compared to the pre-intervention baseline and to control units where the checklist was not implemented. Did the proportion of urine tests ordered with documented urinary symptoms increase? Did UTI rates change? Were there unintended consequences? Review delayed or missed diagnoses of urinary tract infection and sepsis as a balancing measure
Act
The Act phase decides on the next step. If the intervention improved the target metric, it is scaled to the full facility. If results were mixed, the intervention is modified and a second PDSA cycle begins. If the intervention had no effect or caused harm, it is abandoned,and an alternative approach is tested.
PDSA Cycle Example: Reducing Unnecessary Urine Testing
| PDSA Phase | Action | Measurement |
|---|---|---|
| Plan | Surveillance shows UTI rate 2.5/1,000 resident days (above 12-month baseline of 1.5). Audit reveals 60% of urine tests and antibiotic courses for suspected UTI lacked documented urinary symptoms. Intervention: clinical decision support checklist. | Target: reduce UTI diagnoses without documented urinary symptoms from 60% to 25% |
| Do | Implement checklist on Unit A for 4 weeks. Train all RNs and ENs. Engage visiting GPs. | Track checklist completion rate; track urine tests ordered; track UTI diagnoses |
| Study | After 4 weeks: checklist completion 88%; urine tests reduced by 35%; UTI diagnoses without symptoms reduced to 20%; no missed infections identified. | Compare UTI rate Unit A vs Units B and C; review clinical outcomes |
| Act | Results positive. Scale checklist to all units. Schedule re-audit in 3 months. | Ongoing UTI surveillance; 3-month re-audit of checklist compliance |
What Is Audit and Feedback as a CQI Strategy in IPC?
Audit and feedback are the systematic measurements of clinical practice against a defined standard, followed by communication of results to the practitioners whose practice was audited. A Cochrane review of audit and feedback (Ivers et al., 2025) found that it can improve professional practice, but the size of the effect varies, with a median improvement of about 2.7 percentage points across trials. Effects tend to be larger when feedback is specific, timely, repeated and comes with clear action targets.
In IPC, common audit and feedback activities linked to surveillance include:
| Audit Type | What Is Measured | Standard/Benchmark | Feedback Mechanism |
|---|---|---|---|
| Hand hygiene compliance audit | Observed compliance with the 5 Moments for Hand Hygiene | National hand hygiene benchmark of 80% (set for hospitals; use as a reference and set your own target) | Unit-level results posted monthly; individual feedback to non-compliant staff |
| ‘To Dip or Not to Dip’ audit | Appropriateness of urine testing and UTI diagnosis | ACQSC audit tool criteria | Results presented to clinical staff and GPs; action plan developed |
| Environmental cleaning audit | Compliance with cleaning schedules and standards | Facility cleaning policy; the Aged Care Infection Prevention and Control Guide | Results to cleaning staff and clinical managers; link to infection rates |
| PPE compliance audit | Correct selection and use of personal protective equipment | Standard and transmission-based precautions requirements | Observation results fed back to staff with in-the-moment coaching |
| Antimicrobial prescribing audit | Appropriateness of antibiotic prescribing (indication, agent, duration) | Therapeutic Guidelines: Antibiotic; AMS programme criteria | Results to prescribers; pharmacy review; AMS committee |
Audit and feedback work best when feedback is specific (unit-level or individual), timely (within weeks of the audit), and includes a clear action target (e.g., “increase hand hygiene compliance from 68% to 80% by June 2026”).
How Should Surveillance Findings Be Reported to Governance?
Governance reporting translates surveillance data into decisions. Clinical governance committees, IPC committees, and board-level quality committees need different levels of detail, but all need data presented with context, trend information, and recommendations.
| Governance Level | Suggested reporting frequency (adjust to your governance framework) | Content Focus |
|---|---|---|
| IPC committee / Clinical governance committee | Monthly | Detailed infection rates by type, trend charts, audit results, CQI activity progress, issues for escalation |
| Executive / Operations committee | Quarterly | Summary infection rates, significant trends, outbreak events, resource requests, major CQI outcomes |
| Board / Governing body | Quarterly or biannually | High-level dashboard — total infection rate trend, key quality indicator performance, compliance status, strategic risks |
Effective governance reports follow these principles:
Lead with the key message: “UTI rates decreased 25% following the clinical decision support intervention” — not “we collected 147 data points this month”.
Use visual formats: Trend charts, traffic-light dashboards, and comparison tables communicate faster than narrative text.
Include recommendations: Reports without recommendations are informational, not actionable. Every report should include at least one specific recommendation for the committee to consider.
Show the link between action and outcome: When presenting CQI results, show the before-and-after comparison with the intervention clearly identified on the timeline.
How Should Facilities Set Benchmarks and Goals for IPC Improvement?
Benchmarks and goals provide direction for CQI activities. Without targets, surveillance data shows what is happening but gives no indication of what should be happening. Goals should be specific, measurable, achievable, relevant, and time-bound (SMART).
Approaches to setting IPC improvement goals include:
Internal trend targets: ‘Reduce overall infection rate by 15% from the 12-month baseline by December 2026.’ Based on the facility’s own data and improvement trajectory.
National benchmark targets: The Australian national hand hygiene benchmark of 80% (set for hospitals under the National Hand Hygiene Initiative) is widely used as a reference by aged care homes; set your own target and time frame.
Best practice elimination targets: “Achieve zero catheter-associated UTIs in any given quarter.” Aspirational targets for highly preventable infections.
Process compliance targets: ‘Achieve ≥90% completion rate for clinical decision support checklists before urine testing.’ Focuses on the process that drives the outcome.
Goals should be reviewed at least annually and adjusted based on achievement. When a goal is consistently met, it should be tightened. When a goal is consistently missed, investigate whether the goal is unrealistic or whether the intervention strategy needs revision.
How Can Facilities Sustain IPC Improvements Over Time?
Sustaining improvement is the greatest challenge in CQI. Initial improvement following an intervention is common — sustained improvement that persists after the initial focus shifts is rare. Surveillance data provides the mechanism for monitoring sustainability.
Strategies for sustaining IPC improvements include:
Embed changes in systems: Interventions that rely on individual memory or motivation decay over time. Embed changes in forms, checklists, electronic systems, and policies so the default behaviour is the improved behaviour.
Ongoing surveillance monitoring: Continue monitoring the target metric after the intervention. Many teams look for improvement that holds for at least 12 months after rollout before calling it sustained.
Regular re-auditing: Schedule follow-up audits at 3, 6, and 12 months post-intervention. Use audit results as an early warning of backsliding.
Staff orientation and onboarding: New staff must be trained in improved practices from day one. If only existing staff are trained, the improvement erodes as staff turn over.
Celebrate and communicate: Sustained improvement should be recognised and communicated to staff. When staff see that their efforts produce lasting results, motivation for future improvement increases.
Governance accountability: CQI activities should be standing agenda items on governance committee meetings. When governance stops asking about an improvement initiative, staff stop prioritising it.
What Do Surveillance-Driven CQI Projects Look Like in Aged Care IPC?
Effective CQI projects share common features: they are driven by surveillance data, use a structured improvement method such as PDSA, involve frontline staff, and measure outcomes. The three scenarios below are illustrative examples we have built to show how the steps fit together. The figures are examples only, not published results.
Example 1: Reducing Unnecessary Urine Testing (illustrative scenario)
Surveillance data identified UTI incidence rates well above the 12-month baseline. A “To Dip or Not to Dip” audit revealed that 60% of UTI diagnoses lacked documented urinary symptoms. Intervention: clinical decision support checklist implemented with GP engagement. Result: urine tests ordered reduced by 35% within 3 months; UTI incidence rate returned to baseline; antibiotic courses for UTI reduced by 28%. Improvement sustained at 12-month re-audit.
Example 2: Learning from a respiratory cluster (illustrative scenario)
Continuous surveillance showed a cluster of six residents with acute respiratory infection on one unit within 10 days. The cluster met the definition of a suspected outbreak, so the facility tested residents, applied transmission-based precautions, followed its outbreak management plan and notified the local public health unit. After the outbreak was declared over, the IPC Lead used the surveillance data to look for system causes. A hand hygiene audit showed compliance on the affected unit was 52%, compared with a facility average of 74%, so the team ran unit-based education with observation and feedback and added enhanced environmental cleaning to the improvement plan. At the 1-month re-audit, hand hygiene compliance on the unit had risen to 82%. Surveillance continues so the team can see whether respiratory infection rates stay low.
Example 3: Reducing Catheter-Associated UTI (illustrative scenario)
Surveillance data showed CAUTI rate of 6.2 per 1,000 catheter days, higher than the facility’s own previous rate (CAUTI is counted using the McGeer criteria for residents with an indwelling catheter). Device utilisation ratio monitoring revealed 12% of residents had indwelling catheters, with limited documented clinical indications. Intervention: catheter review rounds with GP participation; removal of catheters without ongoing clinical indication; trial of continence alternatives. Result: catheter utilisation reduced from 12% to 7% within 6 months; CAUTI rate reduced to 2.8 per 1,000 catheter days.
For UTI-specific surveillance and the ‘To Dip or Not to Dip’ framework, see UTI Surveillance and the ‘To Dip or Not to Dip’ Framework in Aged Care
How Should Facilities Celebrate and Communicate IPC Improvements?
Communicating improvements to staff is a critical but often neglected component of CQI. Staff who collect surveillance data and implement interventions need to see that their efforts produce results. Without positive feedback, engagement declines and data quality deteriorates.
Visual dashboards: Display current infection rates alongside baseline rates in staff areas. Use clear visual formats — traffic lights, trend arrows, before-and-after comparisons.
Staff meetings: Dedicate time in regular staff meetings to presenting surveillance results and acknowledging improvement. Specific recognition is more effective than generic praise.
Newsletters or bulletins: Include a regular IPC update in the facility newsletter highlighting achievements — “UTI rates reduced 25% this quarter following the new assessment checklist.”
Governance recognition: Include staff recognition in governance reports. Board members acknowledging frontline improvement efforts reinforce organisational commitment
Frequently Asked Questions
What is the PDSA cycle in IPC?
The PDSA (Plan-Do-Study-Act) cycle is a structured quality improvement framework. Plan identifies a problem using surveillance data and designs an intervention. Do implements the intervention on a small scale. Study analyses whether the intervention improved the target metric. Act decides whether to scale, modify, or abandon the intervention based on the evidence.
How often should CQI activities be reviewed?
Active CQI projects should be reviewed monthly at the IPC committee or clinical governance committee. Summary CQI reports should be presented quarterly to executive and board-level committees. Follow-up audits should be scheduled at 3, 6, and 12 months post-intervention to monitor sustainability.
What is audit and feedback in IPC?
Audit and feedback is a CQI strategy that measures clinical practice against a defined standard and communicates results to the practitioners whose practice was measured. A Cochrane review (Ivers et al., 2025) found that audit and feedback can improve professional practice, although the effect varies. It works best when feedback is specific, timely, repeated and includes clear action targets.
How should surveillance data be presented to boards?
Board-level reports should be high-level dashboards showing overall infection rate trends, key quality indicator performance, significant events (outbreaks), and strategic risks. Use visual formats (trend charts, traffic lights) rather than detailed tables. Include recommendations and the status of current CQI activities.
What makes a CQI project successful in aged care IPC?
Successful CQI projects in aged care IPC are driven by surveillance data (not assumptions), use structured methodology (PDSA), involve frontline staff in design and implementation, measure outcomes with ongoing surveillance, and embed changes in systems rather than relying on individual behaviour change.
Related Articles
Infection Surveillance in Aged Care — Complete Guide
How to Set Up an Infection Surveillance Program in Aged Care
Infection Surveillance Data Collection and Analysis for Aged Care
UTI Surveillance and the ‘To Dip or Not to Dip’ Framework in Aged Care
Antimicrobial Stewardship in Aged Care
Outbreak Management in Aged Care
IPC Risk Management in Aged Care
References and Further Reading
The following authoritative sources inform the clinical and regulatory guidance in this article. Links open in a new tab.
- Australian Commission on Safety and Quality in Health Care. Infection Prevention and Control Guide for Residential Aged Care Facilities, Version 1.1. Sydney: ACSQHC; January 2025.
- Aged Care Quality and Safety Commission. Aged care quality and safety reporting — infection data. Canberra: ACQSC; 2025.
- Stone ND, Ashraf MS, Calder J, et al. Surveillance Definitions of Infections in Long-Term Care Facilities: Revisiting the McGeer Criteria. Infect Control Hosp Epidemiol. 2012;33(10):965–977.
- Australian Institute of Health and Welfare. Aged care safety and quality surveillance data. Canberra: AIHW; 2024.
- Communicable Diseases Network Australia. CDNA National Guidelines — surveillance of communicable diseases. Canberra: DoH; 2023.
In This Article
- Why Must Surveillance Data Drive Quality Improvement — Not Just Reporting?
- How Does the PDSA Cycle Apply to IPC Surveillance?
- What Is Audit and Feedback as a CQI Strategy in IPC?
- How Should Surveillance Findings Be Reported to Governance?
- How Should Facilities Set Benchmarks and Goals for IPC Improvement?
- How Can Facilities Sustain IPC Improvements Over Time?
- What Do Surveillance-Driven CQI Projects Look Like in Aged Care IPC?
- How Should Facilities Celebrate and Communicate IPC Improvements?
- Frequently Asked Questions
- Related Articles
About the Author
Lyndon Forrest is the Managing Director of Bug Control — Infection Prevention Services, with over 30 years’ experience supporting aged care facilities across Australia and New Zealand with infection prevention, antimicrobial stewardship, and accreditation readiness.
Clinically reviewed by Bridgette Mackie & Dianne Newey, Clinical Directors.
Ready to Strengthen Your Facility’s Infection Prevention?
The IPS Hub provides aged care facilities across Australia and New Zealand with continuously updated IPC policies, AMS tools, outbreak management resources, and direct support from experienced IPC professionals.