
Home › Knowledge Hub › Infection Surveillance › Infection Surveillance Data Collection and Analysis for Aged Care
Infection Surveillance
By Lyndon Forrest, Managing Director · Clinically reviewed by Bridgette Mackie & Dianne Newey, Clinical Directors · June 2026 · 10 min read
Infection Surveillance Data Collection and Analysis for Aged Care
TL;DR —
Effective infection data collection and analysis in aged care requires structured collection methods, rigorous data quality controls, and systematic analysis techniques. The ACSQHC Aged Care IPC Guide (2024), Chapter 9, identifies six data quality factors: complete, consistent, accurate, timely, valid, and relevant. Infection rates should be expressed as incidence rates per 1,000 resident days to allow comparison across time periods and between facilities. Microsoft Excel is sufficient for most aged care facilities to calculate rates, create trend charts, and prepare governance reports. Data must be interpreted with context — seasonal variation, occupancy changes, and case-mix differences affect rates. Analysis without feedback is wasted effort; findings must reach clinical staff and governance committees.

What Data Collection Methods Are Used for Infection Surveillance in Aged Care?
Infection data collection in aged care uses multiple methods, each capturing different aspects of infection occurrence. No single method is sufficient — effective surveillance programs combine multiple data sources to build a comprehensive picture.
| Collection Method | What It Captures | Strengths | Limitations |
|---|---|---|---|
| Clinical observation | Signs and symptoms identified by nursing staff during routine care | Captures clinical information not available from other sources; real-time | Dependent on staff knowledge and consistency; subjective assessment |
| Clinical record review | Progress notes, care plans, medication charts, and vital signs documentation | Captures retrospective data; can validate prospective data | Documentation quality varies; time-consuming to review |
| Pathology result tracking | Culture results, sensitivity patterns | Objective, laboratory-confirmed data | Not all infections have specimens collected; results may be delayed |
| Incident management systems | Infection events recorded in the facility’s incident/risk software | Integrated with governance reporting; supports workflow automation | May lack infection-specific fields; depends on staff entering data |
| Point-prevalence surveys | Snapshot of all current infections across the facility on a single day | Captures overall infection burden; useful for benchmarking | Only a snapshot — misses infections that resolve before or after the survey date |
| Antimicrobial prescribing data | Antibiotics prescribed, including the indication, the antimicrobial, dose, frequency and route | Links infection surveillance to AMS; identifies prescribing patterns | Antibiotic prescription does not always equal infection; requires clinical correlation |
The ACSQHC Aged Care IPC Guide (2024) recommends combining prospective clinical observation (real-time recording by staff) with periodic retrospective record review (validation by the IPC Lead). Pathology results should be cross-referenced with clinical data to confirm surveillance classifications.
For guidance on setting up data collection tools as part of a surveillance program, see How to Set Up an Infection Surveillance Program in Aged Care
How Should Facilities Ensure Data Quality in Infection Surveillance?
Data quality determines whether surveillance findings are trustworthy. The ACSQHC Aged Care IPC Guide (2024), Chapter 9, defines six data quality factors. Every data quality failure introduces error into infection rate calculations and undermines the credibility of surveillance reports.
| Data Quality Factor | What It Means | How to Achieve It |
|---|---|---|
| Complete | All required data fields are populated for every infection record | Use structured data entry forms with mandatory fields; audit for completeness monthly |
| Consistent | Data is collected the same way by all staff members | Standardised surveillance definitions; regular inter-rater reliability exercises |
| Accurate | Data correctly reflects the clinical event | IPC Lead validates all entries against surveillance definitions before inclusion in analysis |
| Timely | Data is recorded close to the time of the infection event | Real-time or same-day data entry; weekly compliance checks for timeliness |
| Valid | Data measures what it is intended to measure | Use surveillance definitions (McGeer criteria) rather than clinical judgement alone |
| Relevant | Collected data serves a defined purpose | Only collect data elements that will be analysed and reported; remove unused fields |
What Data Validation Techniques Should Facilities Use?
Data validation is the process of checking surveillance data for errors before analysis. Validation should be performed routinely — not just when data looks unusual.
IPC Lead review: The IPC Lead reviews every infection record to confirm that surveillance definitions have been correctly applied. Records that do not meet criteria are reclassified or excluded.
Pathology cross-check: Infection records are compared against pathology results to confirm that cultures and sensitivities align with the recorded infection type.
Duplicate checking: Surveillance systems should flag potential duplicate entries for the same resident and infection within a defined window (e.g., 14 days).
Inter-rater reliability: Periodically, two or more staff members independently classify the same set of clinical scenarios. Agreement rates below 80% indicate the need for retraining.
Outlier review: Unusually high or low infection counts in any month trigger investigation — are they real or artefactual?
Need help implementing this in your facility? The IPS Hub gives your IPC Lead instant access to ready-made policies, procedures, and audit tools — updated monthly.
How Are Infection Rates Calculated in Aged Care?
Infection rates in aged care are calculated using a standard epidemiological formula: the number of new infections (numerator) divided by the population at risk (denominator), multiplied by a constant (typically 1,000). The denominator is usually expressed as resident days — the total number of days that residents were present in the facility during the reporting period.
What Is the Incidence Rate Formula?
Incidence rate = (Number of new infections in the period ÷ Total resident days in the period) × 1,000. This produces a rate expressed as infections per 1,000 resident days. Using resident days as the denominator adjusts for occupancy fluctuations — a facility with 80% occupancy is not directly comparable to a facility with 95% occupancy unless rates are adjusted.
How Are Resident Days Calculated?
Resident days = the sum of all days that each resident was present in the facility during the reporting period. A facility with 100 beds at 90% average occupancy over 30 days has approximately 2,700 resident days (100 × 0.90 × 30 = 2,700). Most aged care facilities can derive resident days from their occupancy or census data.
How Are Device-Associated Infection Rates Calculated?
Device-associated infection rates use device days as the denominator. For example, catheter-associated UTI (CAUTI) rate = (Number of CAUTIs ÷ Total urinary catheter days) × 1,000. This adjusts for the fact that only residents with catheters are at risk of CAUTI. Device utilisation ratio = Total catheter days ÷ Total resident days — this metric quantifies how heavily the facility relies on urinary catheters.
Example Calculation
| Metric | Value |
|---|---|
| Facility beds | 120 |
| Average monthly occupancy | 92% (approximately 110 residents) |
| Reporting period | January 2026 (31 days) |
| Total resident days | 110 × 31 = 3,410 |
| New UTIs identified (meeting McGeer criteria) | 5 |
| UTI incidence rate | (5 ÷ 3,410) × 1,000 = 1.47 per 1,000 resident days |
| Residents with urinary catheters (average) | 8 |
| Total catheter days | 8 × 31 = 248 |
| CAUTIs identified | 1 |
| CAUTI rate | (1 ÷ 248) × 1,000 = 4.03 per 1,000 catheter days |
How Should Facilities Analyse Infection Surveillance Trends?
Trend analysis examines infection rates over time to identify patterns — increasing rates (deterioration), decreasing rates (improvement), seasonal patterns, or sudden spikes (potential outbreaks). Trend analysis requires a minimum of 6–12 months of baseline data for meaningful comparison.
Effective trend analysis techniques for aged care include:
Run charts: Plot monthly infection rates as a line graph over time. A run chart with the median line highlighted allows visual identification of trends (runs above or below the median).
Statistical process control (SPC) charts: Plot infection rates with upper and lower control limits. Points outside the control limits signal statistically significant variation requiring investigation.
Year-on-year comparison: Compare the same month across years to identify seasonal patterns — e.g., respiratory infection rates in July 2025 vs July 2026.
Infection type breakdown: Analyse trends by infection type separately — an overall stable rate may mask increasing UTIs offset by decreasing respiratory infections.
How Can Microsoft Excel Be Used for Surveillance Analysis?
Microsoft Excel is the most accessible analysis tool for aged care infection surveillance. A well-designed Excel workbook can support the full analysis cycle.
Data entry sheet: Structured table with columns for each data element, using data validation (drop-down lists) to ensure consistency.
Summary sheet: Formulae that automatically calculate monthly infection counts and rates from the data entry sheet (COUNTIFS, SUMIFS functions).
Charts sheet: Line charts showing infection rates over time, with separate series for each infection type. Use Excel’s built-in trendline function for visual trend identification.
Dashboard: A summary page combining key metrics — total infections, infection rate, top infection types, comparison to baseline — for governance reporting.
How Should Facilities Benchmark Infection Rates?
Benchmarking compares the facility’s infection rates against external reference points — national averages, peer facilities, or published rates in the literature. Benchmarking provides context that raw rates alone cannot — an infection rate of 2.0 per 1,000 resident days is meaningless without knowing what rate is typical.
Australian-specific benchmarking sources include:
National Aged Care Mandatory QI Program data: Published annually by the Department of Health and Aged Care, providing national and peer-group quality indicator rates.
AURA Surveillance System: Provides national antimicrobial prescribing and resistance data for benchmarking antimicrobial use.
Published literature: Australian and international studies reporting infection rates in long-term care facilities provide published reference ranges.
Internal benchmarking: Multi-site providers can compare rates across their own facilities, adjusting for case-mix and size differences.
Benchmarking must account for differences in surveillance methodology, case mix, and facility size. A facility using McGeer criteria will report lower infection rates than a facility counting all positive cultures — the rates are not comparable unless the same definitions are applied.
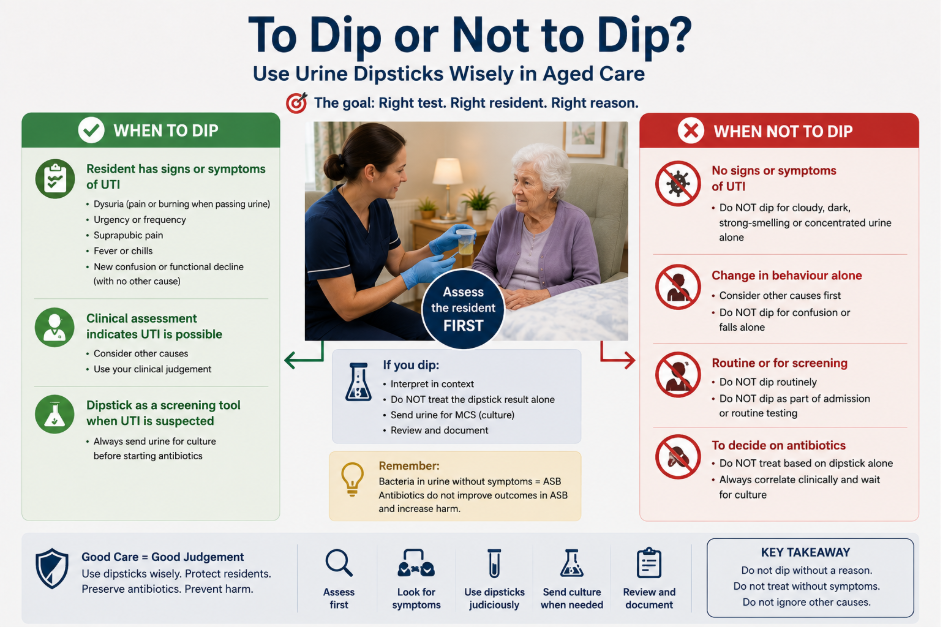
McGeer criteria are surveillance definitions only. They are not used to decide whether to test or treat an individual resident. For clinical decisions, follow the Aged Care Quality and Safety Commission’s To Dip or Not to Dip clinical pathway. Any resident who is unwell, deteriorating or showing signs of sepsis must be escalated straight away, whether or not they meet any criteria.
How Should Infection Surveillance Data Be Reported to Governance?
Infection surveillance data must be reported to governance committees (clinical governance committee, IPC committee, or equivalent) in a format that supports decision-making. Reports should be concise, visual, and action-oriented — not dense tables of numbers.
An effective monthly surveillance report for governance should include:
Summary dashboard: Total infections, overall infection rate per 1,000 resident days, comparison to previous month and same month last year.
Trend chart: Line chart showing infection rates over the past 12 months with the baseline median or target line.
Infection type breakdown: Table or bar chart showing the distribution of infections by type.
Significant findings: Narrative summary of any clusters, outbreaks, trends, or issues identified during the reporting period.
Actions taken: Summary of CQI activities initiated or ongoing in response to surveillance findings.
Recommendations: Specific actions recommended to governance for approval — e.g., targeted audit of catheter care, review of antibiotic prescribing for UTIs.
For guidance on presenting data to staff and using surveillance findings for improvement, see Using Surveillance Data for Continuous Quality Improvement in Aged Care IPC
How Should Facilities Present Infection Data to Clinical Staff?
Clinical staff need different information from governance committees. Staff feedback should be frequent, visual, and practice-focused — connecting surveillance data to specific actions staff can take.
Monthly infection summary poster: A one-page visual summary posted in staff areas showing infection counts, rates, and trends. Use traffic-light colours (green = below baseline, amber = at baseline, red = above baseline).
Unit-level data: Where possible, provide data at the unit or wing level rather than facility-wide — staff engage more with data relevant to their specific area.
Link data to practice: When presenting elevated UTI rates, include information about catheter care compliance rates. Staff can see the connection between their practice and infection outcomes.
Celebrate success: When infection rates decrease following an intervention, communicate this to staff. Positive reinforcement motivates continued data collection.
Frequently Asked Questions
What is the best way to calculate infection rates in aged care?
Infection rates in aged care should be calculated as incidence rates per 1,000 resident days: (number of new infections ÷ total resident days) × 1,000. This formula adjusts for occupancy changes and allows comparison across time periods. Device-associated infection rates use device days as the denominator.
What are the six data quality factors for infection surveillance?
The ACSQHC Aged Care IPC Guide (2024) identifies six data quality factors: complete (all fields populated), consistent (same methods used by all staff), accurate (correctly reflects clinical events), timely (recorded close to the event), valid (measures what it intends to measure), and relevant (serves a defined purpose).
Can aged care facilities use Excel for infection surveillance?
Microsoft Excel is a suitable tool for infection surveillance in most aged care facilities. A structured workbook with data entry sheets, calculated summary fields, and automated charts can support the full analysis cycle from data entry through to governance reporting.
How often should infection surveillance data be reported?
Infection surveillance data should be reported monthly to the IPC committee or clinical governance committee. Quarterly summary reports may be submitted to boards or executive committees. Urgent findings — such as clusters or outbreaks — should be reported immediately through the facility’s escalation pathway.
What is the difference between incidence and prevalence?
Incidence measures new infections occurring during a defined period (rate of new cases). Prevalence measures the proportion of residents with an infection at a specific point in time (snapshot of current infections). Incidence is preferred for ongoing surveillance; prevalence is useful for periodic surveys.
Related Articles
Infection Surveillance in Aged Care — Complete Guide
How to Set Up an Infection Surveillance Program in Aged Care
UTI Surveillance and the ‘To Dip or Not to Dip’ Framework in Aged Care
Using Surveillance Data for CQI in Aged Care IPC
Antimicrobial Stewardship in Aged Care
Outbreak Management in Aged Care
References and Further Reading
The following authoritative sources inform the clinical and regulatory guidance in this article. Links open in a new tab.
- Australian Commission on Safety and Quality in Health Care. Infection Prevention and Control Guide for Residential Aged Care Facilities, Version 1.1. Sydney: ACSQHC; January 2025.
- Aged Care Quality and Safety Commission. Aged care quality and safety reporting — infection data. Canberra: ACQSC; 2025.
- Stone ND, Ashraf MS, Calder J, et al. Surveillance Definitions of Infections in Long-Term Care Facilities: Revisiting the McGeer Criteria. Infect Control Hosp Epidemiol. 2012;33(10):965–977.
- Australian Institute of Health and Welfare. Aged care safety and quality surveillance data. Canberra: AIHW; 2024.
- Communicable Diseases Network Australia. CDNA National Guidelines — surveillance of communicable diseases. Canberra: DoH; 2023.
In This Article
- What Data Collection Methods Are Used for Infection Surveillance in Aged Care?
- How Should Facilities Ensure Data Quality in Infection Surveillance?
- How Are Infection Rates Calculated in Aged Care?
- How Should Facilities Analyse Infection Surveillance Trends?
- How Should Facilities Benchmark Infection Rates?
- How Should Infection Surveillance Data Be Reported to Governance?
- How Should Facilities Present Infection Data to Clinical Staff?
- Frequently Asked Questions
- Related Articles
About the Author
Lyndon Forrest is the Managing Director of Bug Control — Infection Prevention Services, with over 30 years’ experience supporting aged care facilities across Australia and New Zealand with infection prevention, antimicrobial stewardship, and accreditation readiness.
Clinically reviewed by Bridgette Mackie & Dianne Newey, Clinical Directors
Ready to Strengthen Your Facility’s Infection Prevention?
The IPS Hub provides aged care facilities across Australia and New Zealand with continuously updated IPC policies, AMS tools, outbreak management resources, and direct support from experienced IPC professionals.